| Welcome |
|
| Download Report Cover |
 |
|
・Meet a deadline |
||
Recording |
|
* Record your observed result on your notebook. Do not scribble data on a memo pad. * Summarize your results in graphs during the lab to examine your data . |
| Report Parts & Arragement | Any scientific paper or labreport consists of the followings: | |
| 1. Title | A good title is straighforward and uses suitable technical keywords. Ends with a noun.A | |
2. Summary (Abstract) |
A good abstract is a concise (100 to 200 words) summary of the purpose of the report, the data presented and the author's major conclusions. Use past tense. | |
| 3. Introduction | (3-1) Objective : "Why was this study performed?" (3-2) Theory and Past knowledge: "What knowledge already exists about this subject?" (3-3) Hypothesis and Experimental design |
|
| 4. Experimental | Be compact in lab reports! Describein detail if you have what you figured out. | |
| 5. Results | * Summarize the data from the experiments clearly in sequence without discussing their implications. |
|
| 6. Discussion | * Should not just be a restatement of the results but emphasize interpretation of the data, relating them to existing theory and knowledge. * Speculation is appropriate, if it is so identified. * Should explain the logic that allows you to accept or reject your original hypothesis. * Suggestions for the improvement of esperimental design may also be included here. |
|
| 7. Conclusions | * Clarify what conclusions have you got in reference to your objectives. |
|
| 8. Opinions | * This section is not included in scientific papers but should be included in high school reports. | |
| 9. References | * List the books, websites or reports by your seniors or friends if you read them as reference. |
| ・Theory and experiment complement eache other. Note that experimentation is not "confirming a theory." Experiment reveals the true physics of nature to within uncertainties and may invite the development of new theory (experiment cannnot cofirm theory, only fail to disprove it).(1) |
| ・If you notice that all your reports are written for readers, you will find the most suitable style and expressions. |
| 2 Measurement, Significant Figures, Tables, Figures, Graphs | ||||||||||
| 2.1 Reading Data |  |
The smallest division is 1, so we must read the value to  1/10 of 1. The value we read from this measurement should be 22.2. 1/10 of 1. The value we read from this measurement should be 22.2. |
||||||||
2.2 Significant |
|
* Leading zeros are never significant. * Imbedded zeros are always significant. *Trailing zeros are significant only if the decimal point is specified. * Hint: Change the number to scientific notation. It is easier to see.
|
||||||||
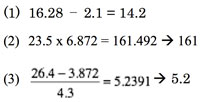
2.3 Calculation and Significant Figures |
|
|
||||||||
| 2.4 Rounding | * Example 1: Round to 3 significant figures: * Example 2: Round to 2 significant figures: * Example 3: Round to 2 significant figures: * Example 4: Round to 2 significant figures: * Example 5: Round to 2 significant figures: |
|||||||||
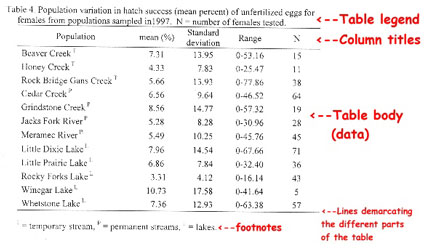
2.5 Tables (ref) |
|
|
||||||||
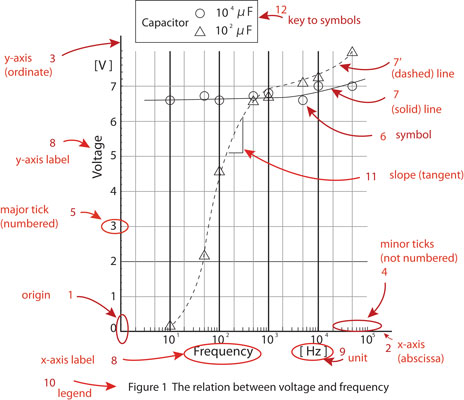
| 2.6 Figures | ||||||||||
2.7 Graphs (ref) |
 |